
![[VIP] Unlimited Pass 2026.03.27](https://i.pinimg.com/1200x/d2/f8/2e/d2f82e903b9ca33b0f13704cc85a3d8a.jpg)


![[LS] ls.graphics Pass 2026.02.16](https://i.pinimg.com/1200x/8d/ca/7f/8dca7ff72d8b698f955649340d0ff398.jpg)

![[PRO] Craftwork Pass 2025.06.11](https://i.pinimg.com/1200x/98/d2/f0/98d2f0169226b431f4727441ecc6aa06.jpg)


![[VIP] Creovo: Creative Portfolio](https://i.pinimg.com/1200x/92/5d/39/925d39b614ae4e39adda25b73837f82b.jpg)


![[VIP] Voltz: Electric Car Website Template](https://i.pinimg.com/1200x/03/ba/41/03ba41513483727fcd26b95349750783.jpg)
![[VIP] Zyra: Coded Chat AI Dashboard](https://i.pinimg.com/1200x/ce/7b/92/ce7b926f22423fc046659dfe1dd7a604.jpg)
![[$] AlignUI: Code Library](https://i.pinimg.com/1200x/8d/91/1c/8d911c0a22483842cff69c130e80c37b.jpg)
![[VIP] The Grid Deck Template](https://i.pinimg.com/1200x/f2/df/6d/f2df6d865d31ed4400ddd74137a5a79e.jpg)

![[VIP] Solaris: Sales Forecast & Pipeline Review Deck](https://i.pinimg.com/1200x/ba/7c/48/ba7c485ac40a51054cf9074aead204e2.jpg)
![[VIP] Brand Guideline Presentation](https://i.pinimg.com/1200x/64/87/a7/6487a7c4da21072150a1664f83a6a234.jpg)


![[VIP] 44 Device Mockups: Metal Scene Pack](https://i.pinimg.com/1200x/96/0c/c4/960cc4d39f6f9f08c4ba4a40ae740a65.jpg)
![[LS] iPhone 17 Mockup](https://i.pinimg.com/1200x/18/42/c1/1842c11e3da971765bdcfbc5315f3df8.jpg)
![[LS] iPhone 17 Pro Max Mockups](https://i.pinimg.com/1200x/f0/2a/72/f02a724ed9f52ac4a1c66b5614809111.jpg)
![[LS] AE-Mockups, Apple Devices](https://i.pinimg.com/1200x/03/04/9b/03049ba79acaa546ae6389639f89bcc1.jpg)


![[VIP] Volnitsa: BLNDR MINI (2025)](https://i.pinimg.com/1200x/c3/f7/0a/c3f70ae1126be5c0af1977e58b56ba7a.jpg)

![[VIP] React Three Fiber: The Ultimate Guide to 3D Web Development](https://i.pinimg.com/1200x/78/02/1f/78021ffdfc8113cc8caba5b2c563ead4.jpg)
![[VIP] Ryan Hayward: Ultimate Framer Masterclass 3.0](https://i.pinimg.com/1200x/48/d6/3f/48d63f9723d7c49e6c34c182557c7431.jpg)


![[VIP] Whoooa! 156 vector Lottie animations](https://design.rip/uploads/cover/blog/whoooa-156-vector-animations.webp)


![[VIP] Staff Product Designer (ENG, RUS)](https://i.pinimg.com/1200x/0c/52/a0/0c52a08d8b0a25329806437933cf538f.jpg)


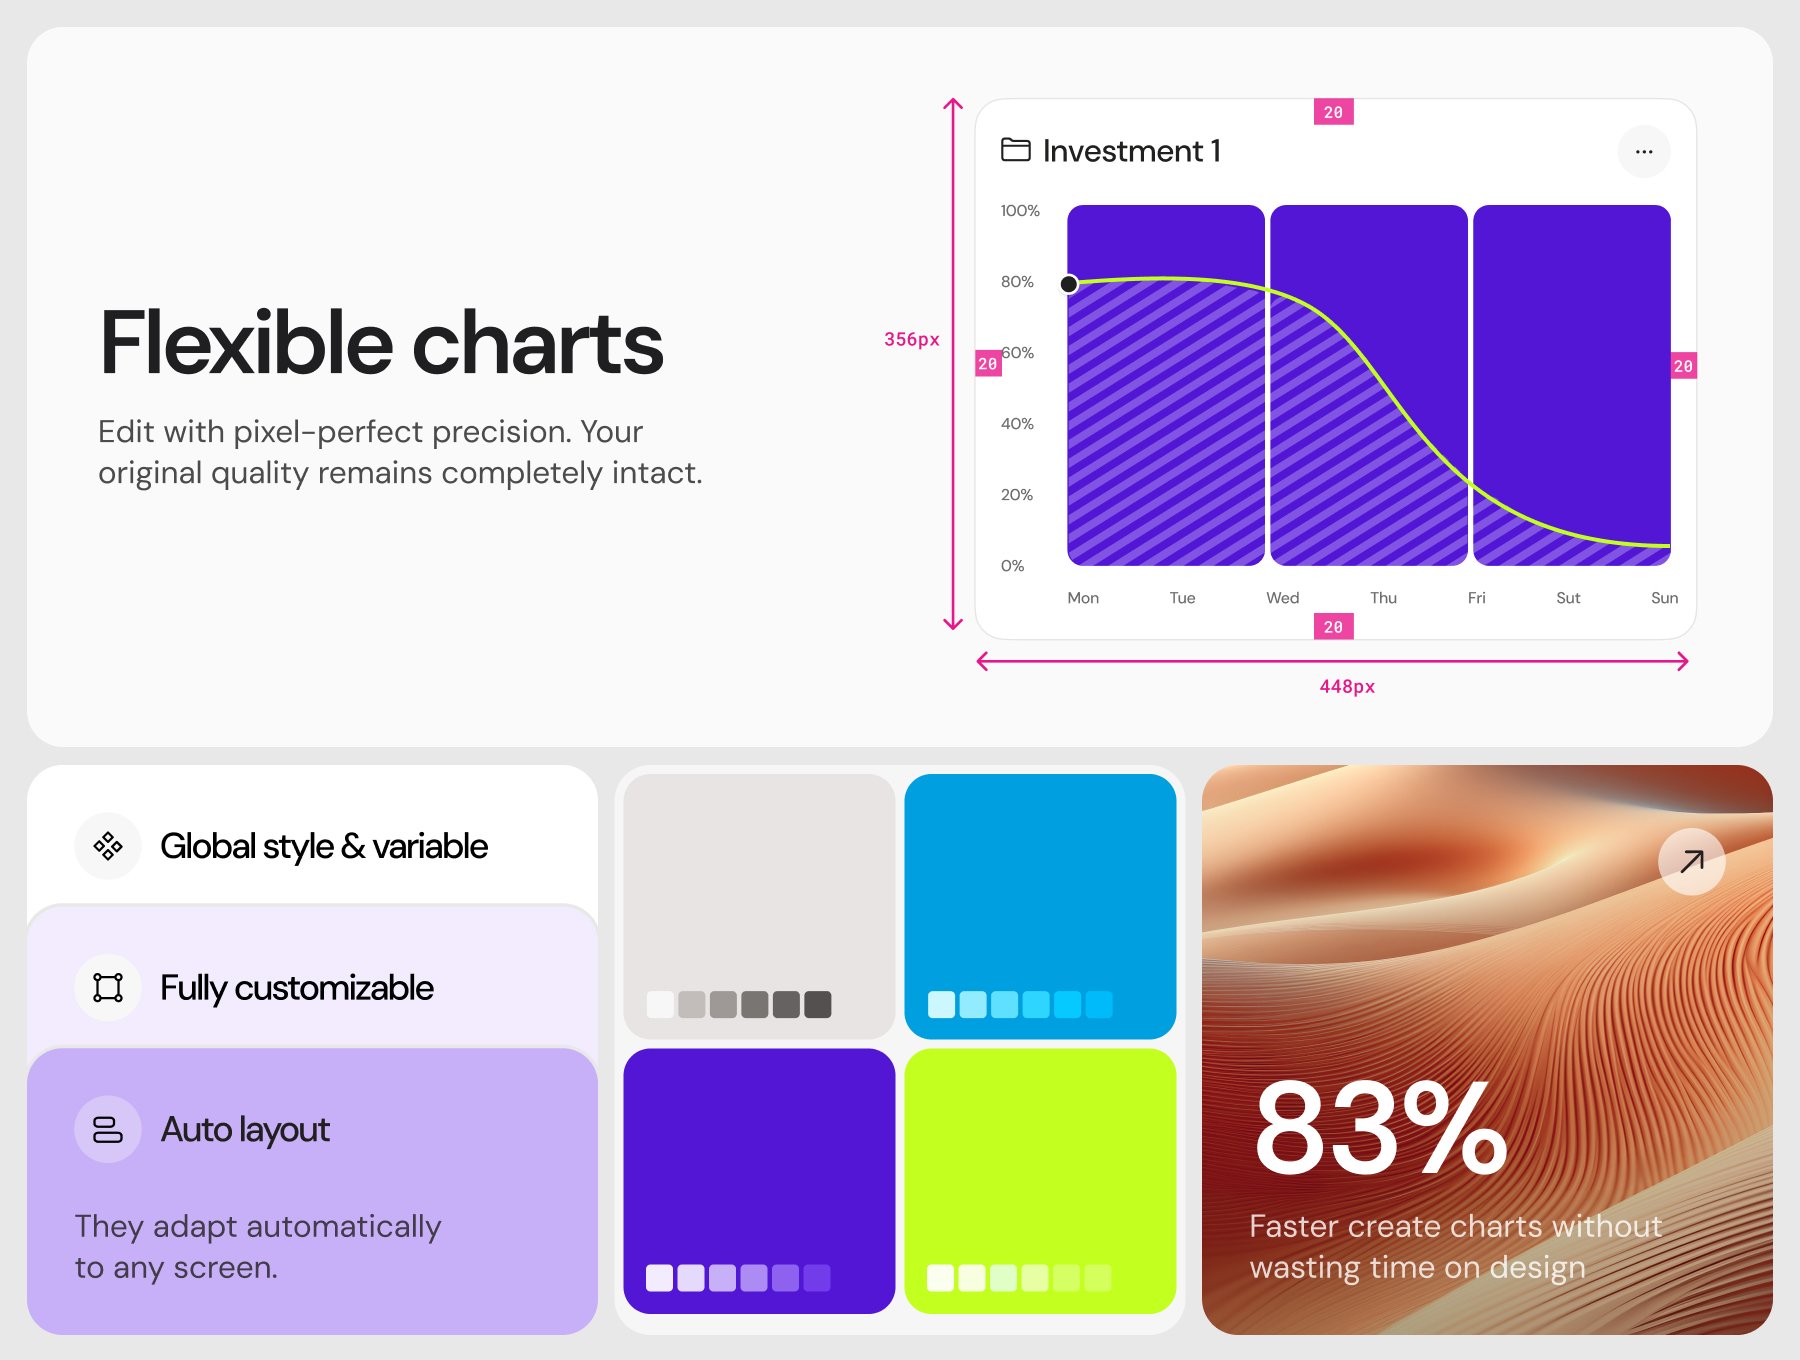
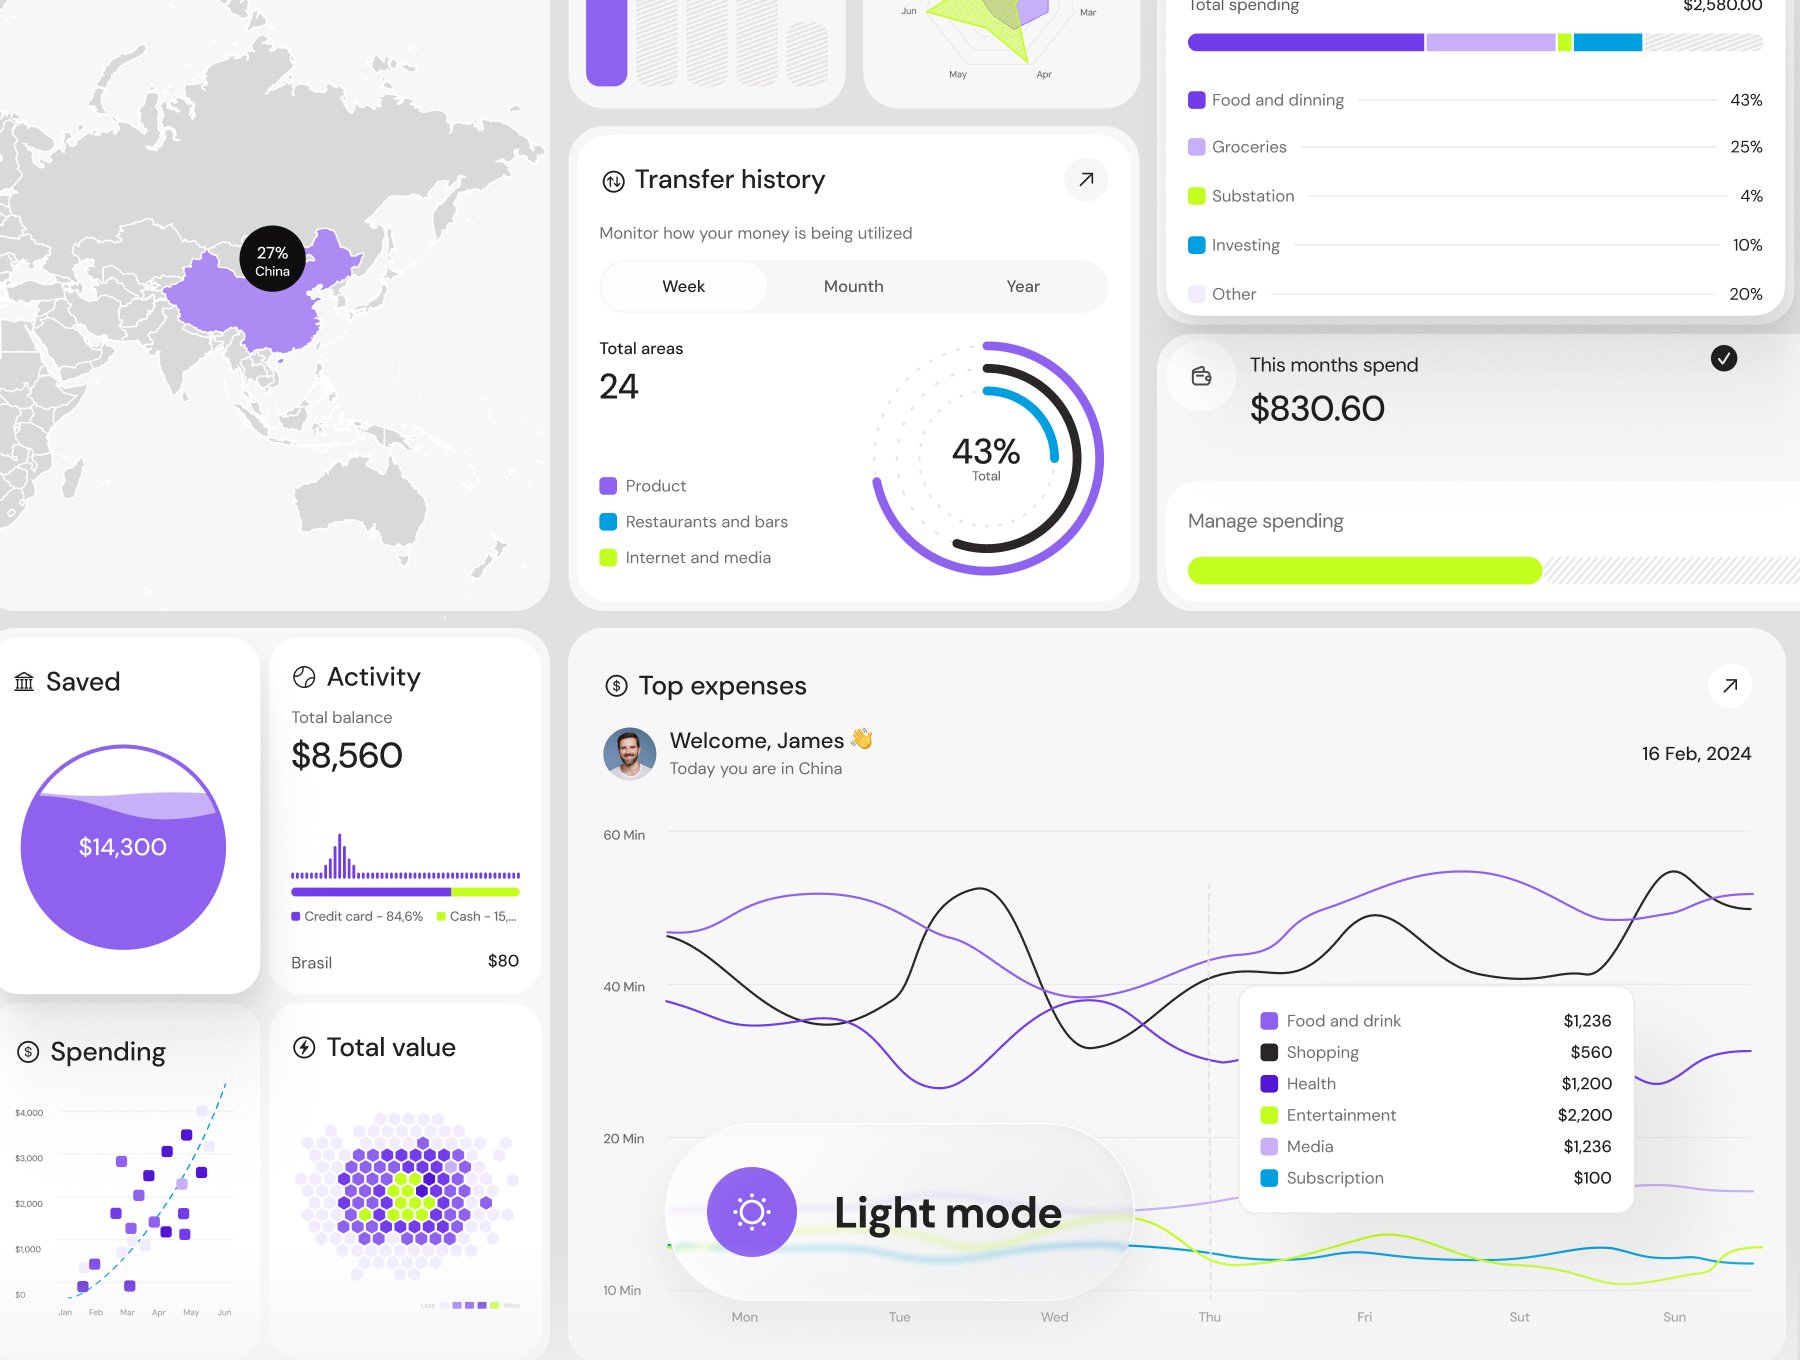
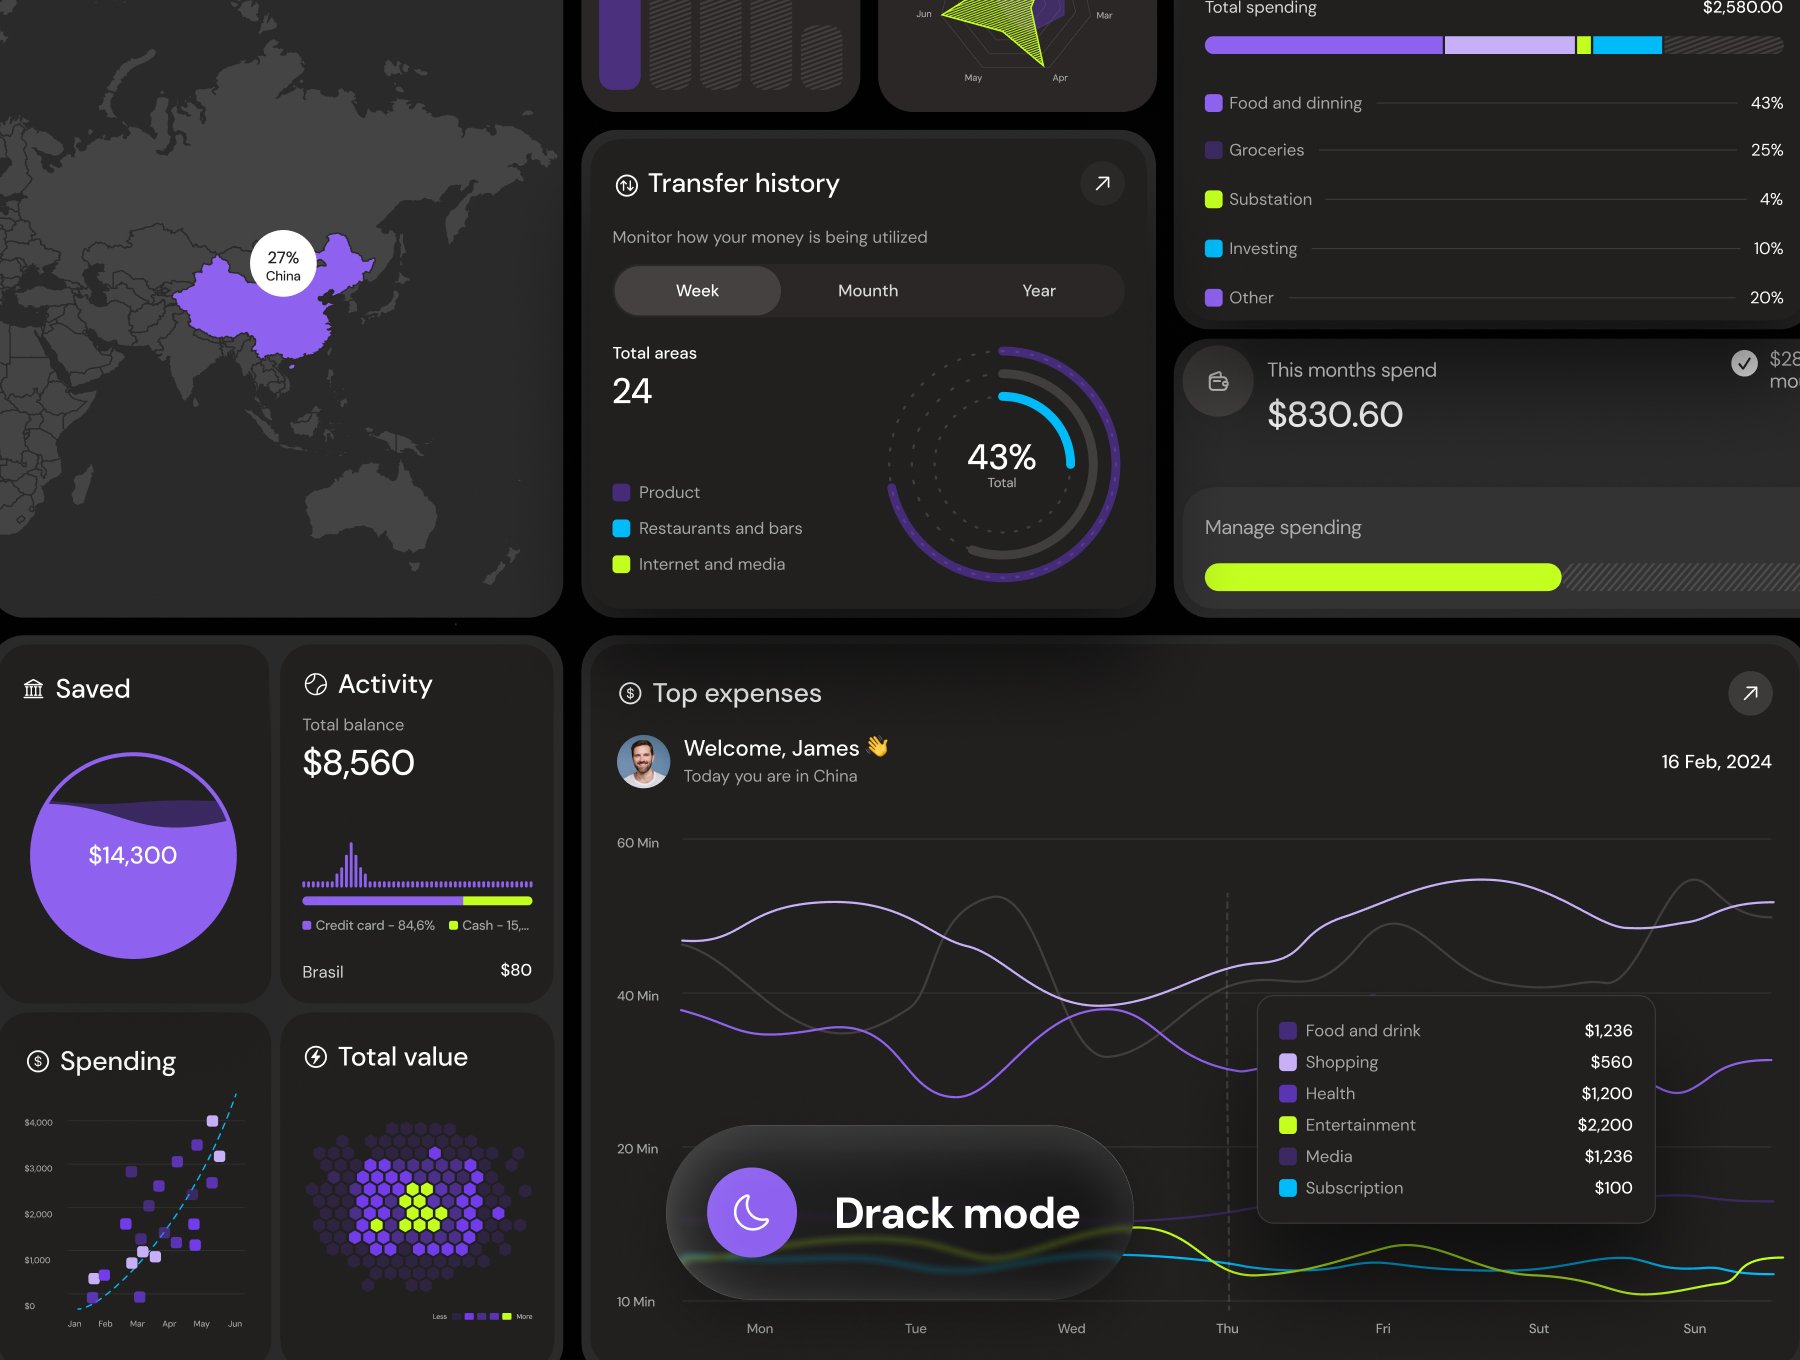
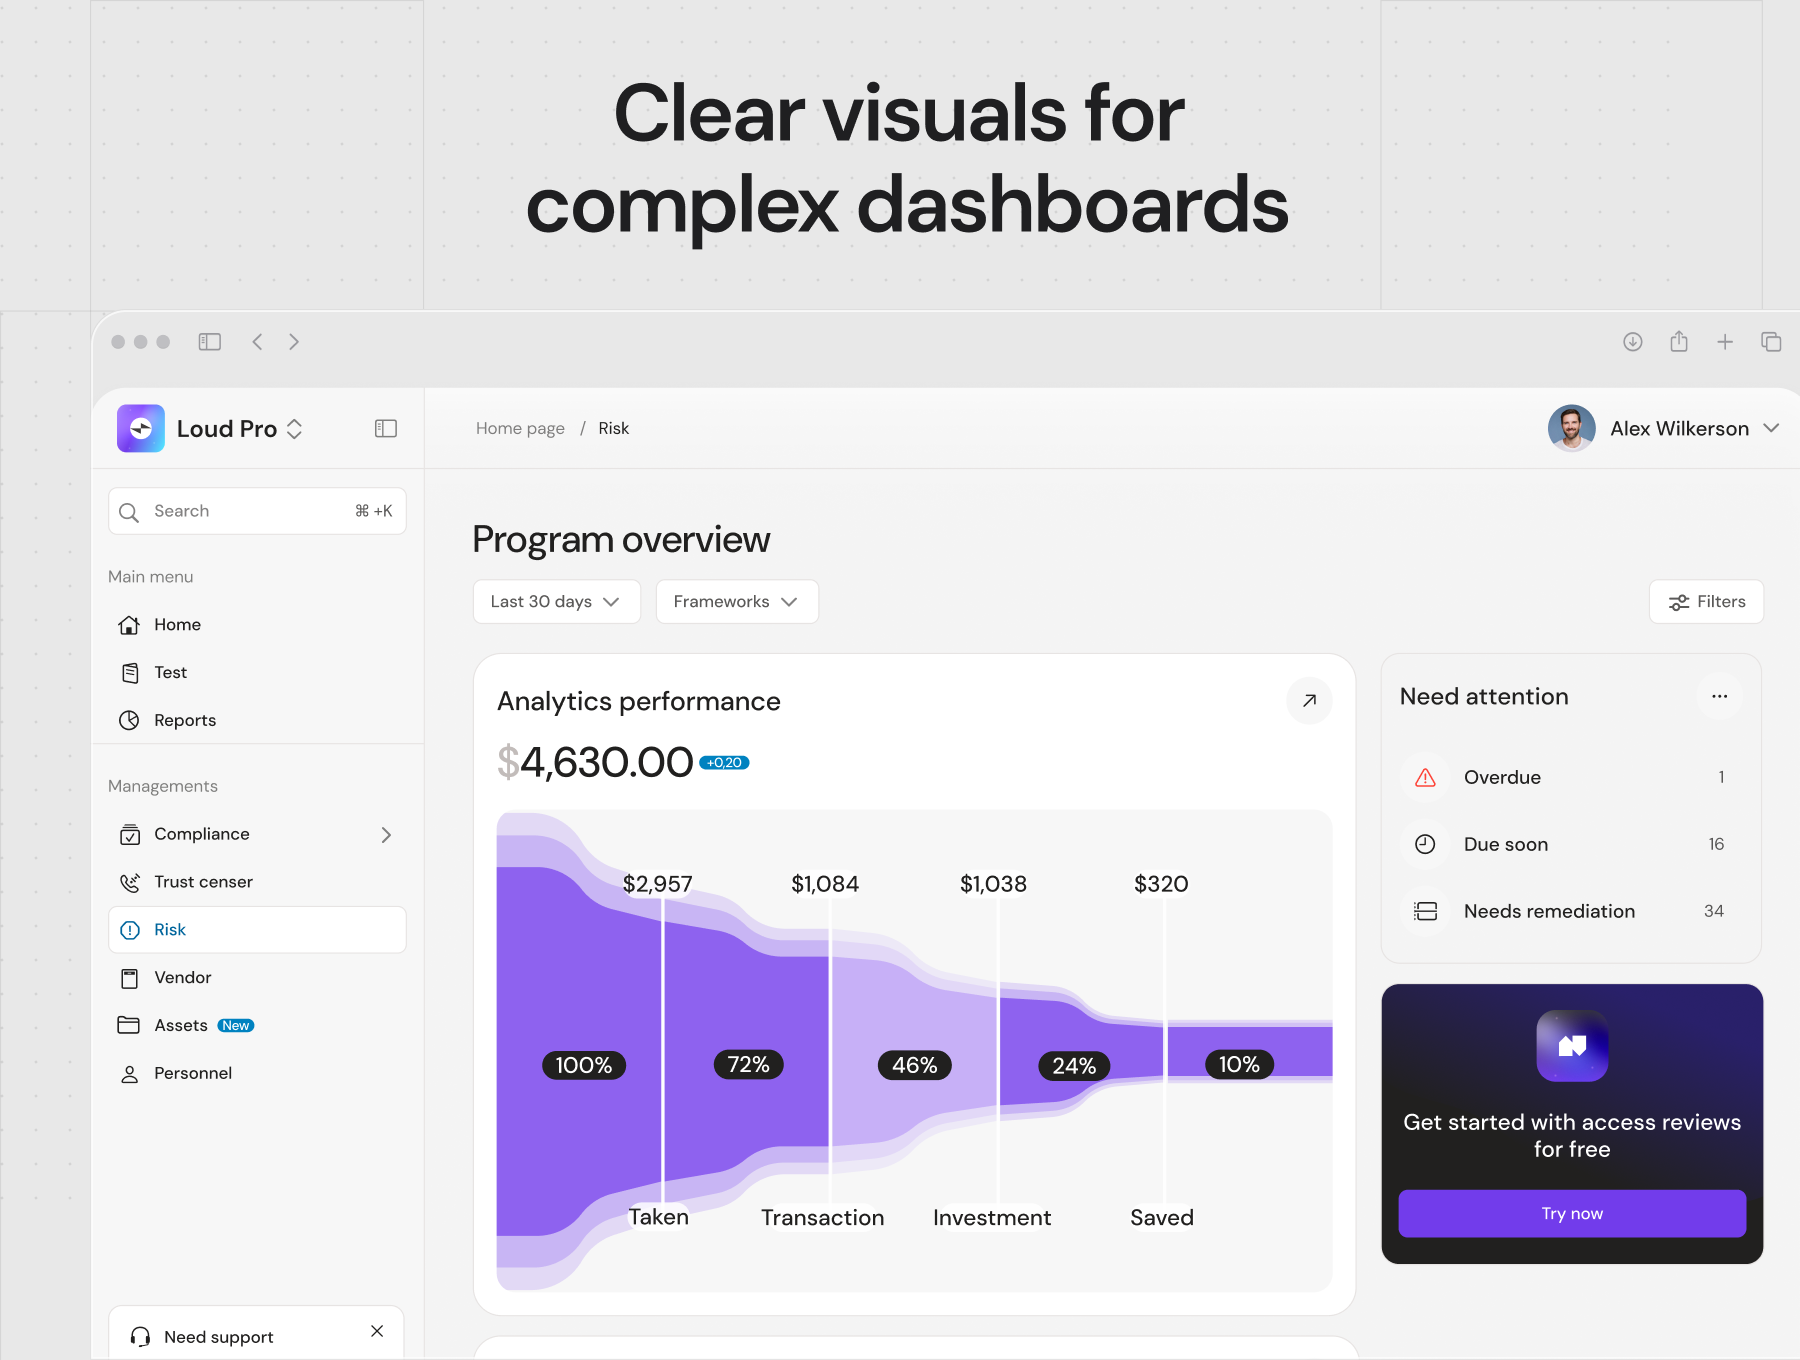
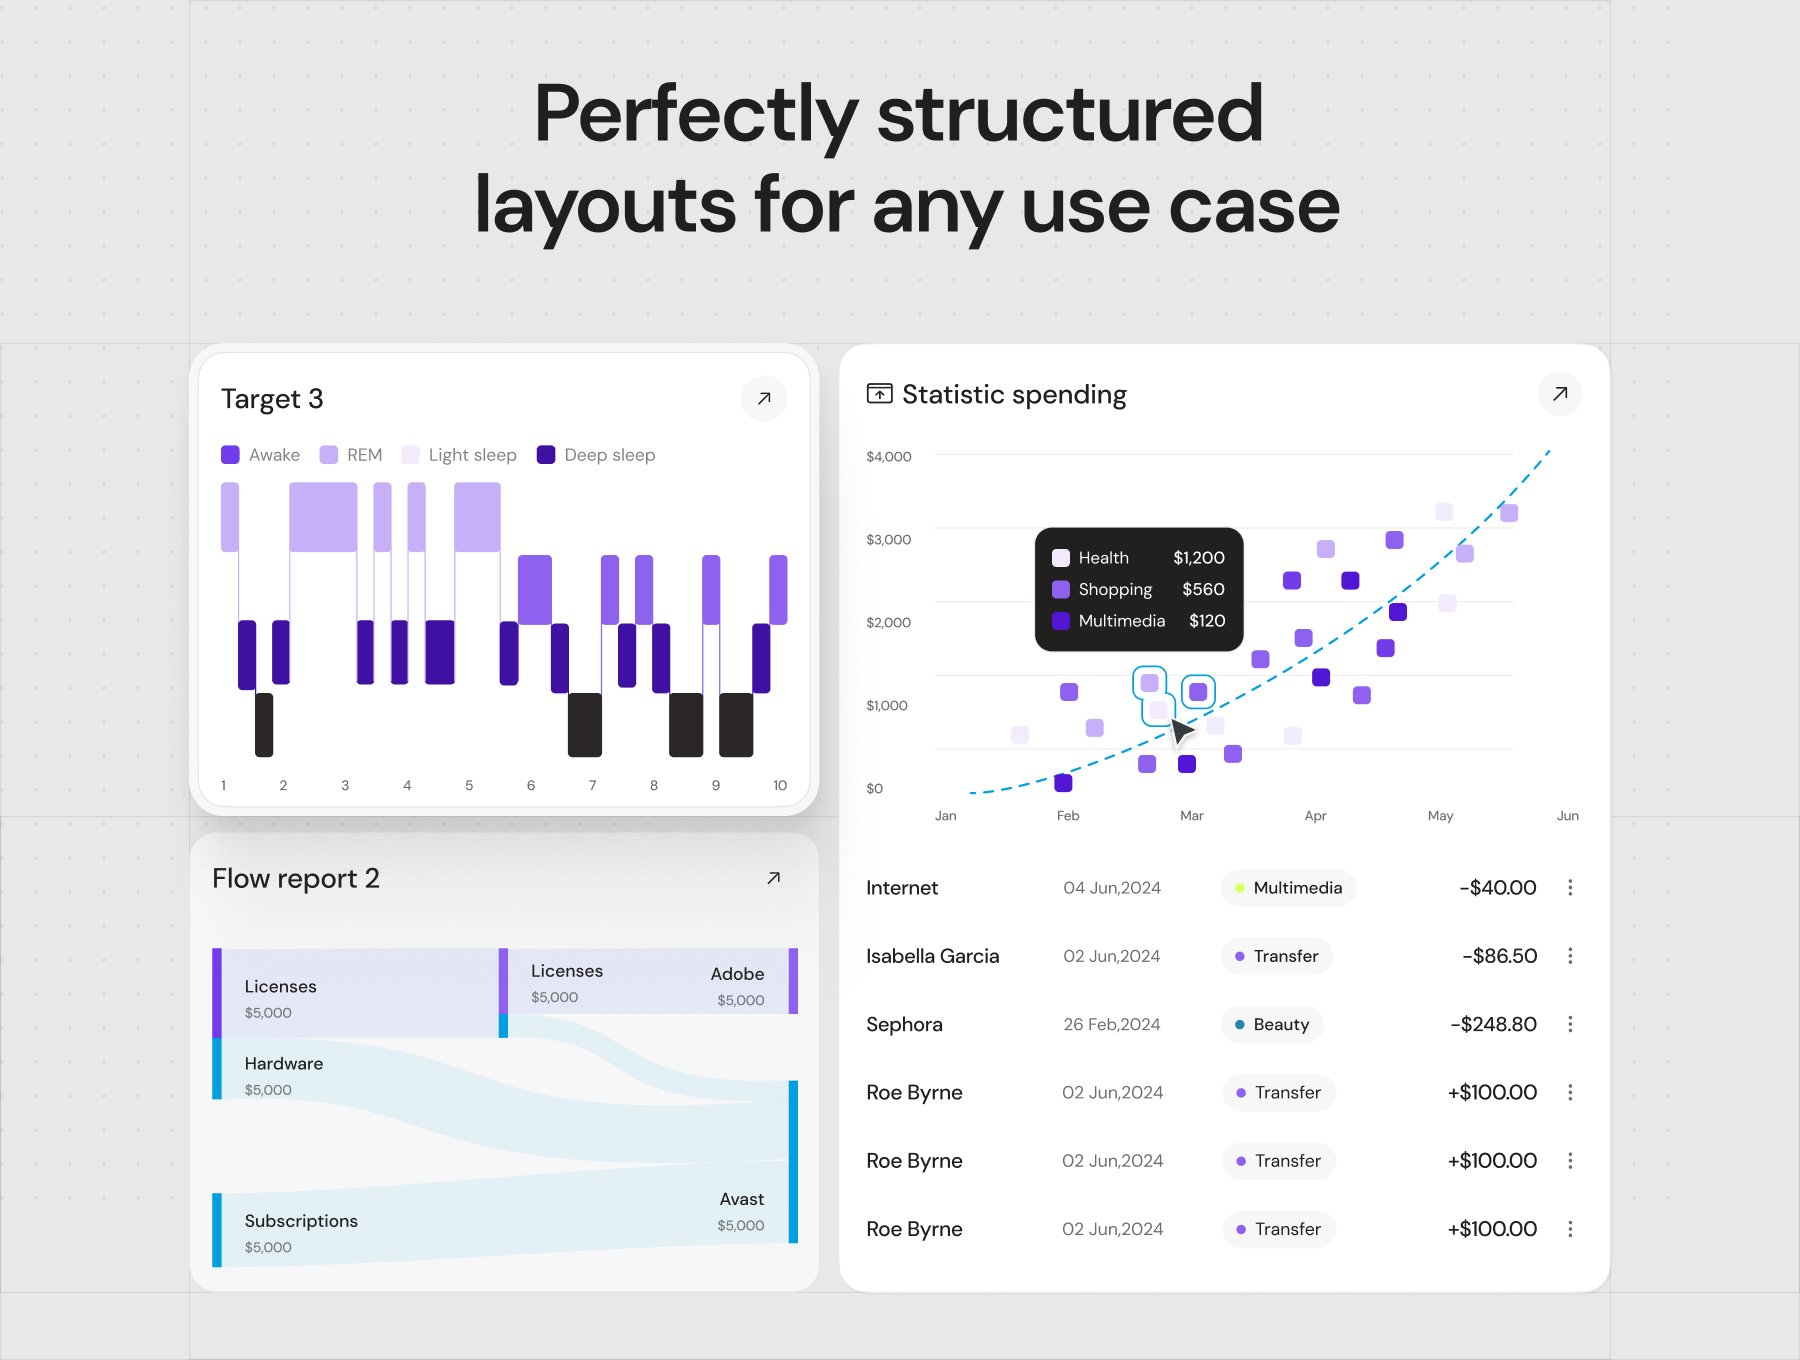
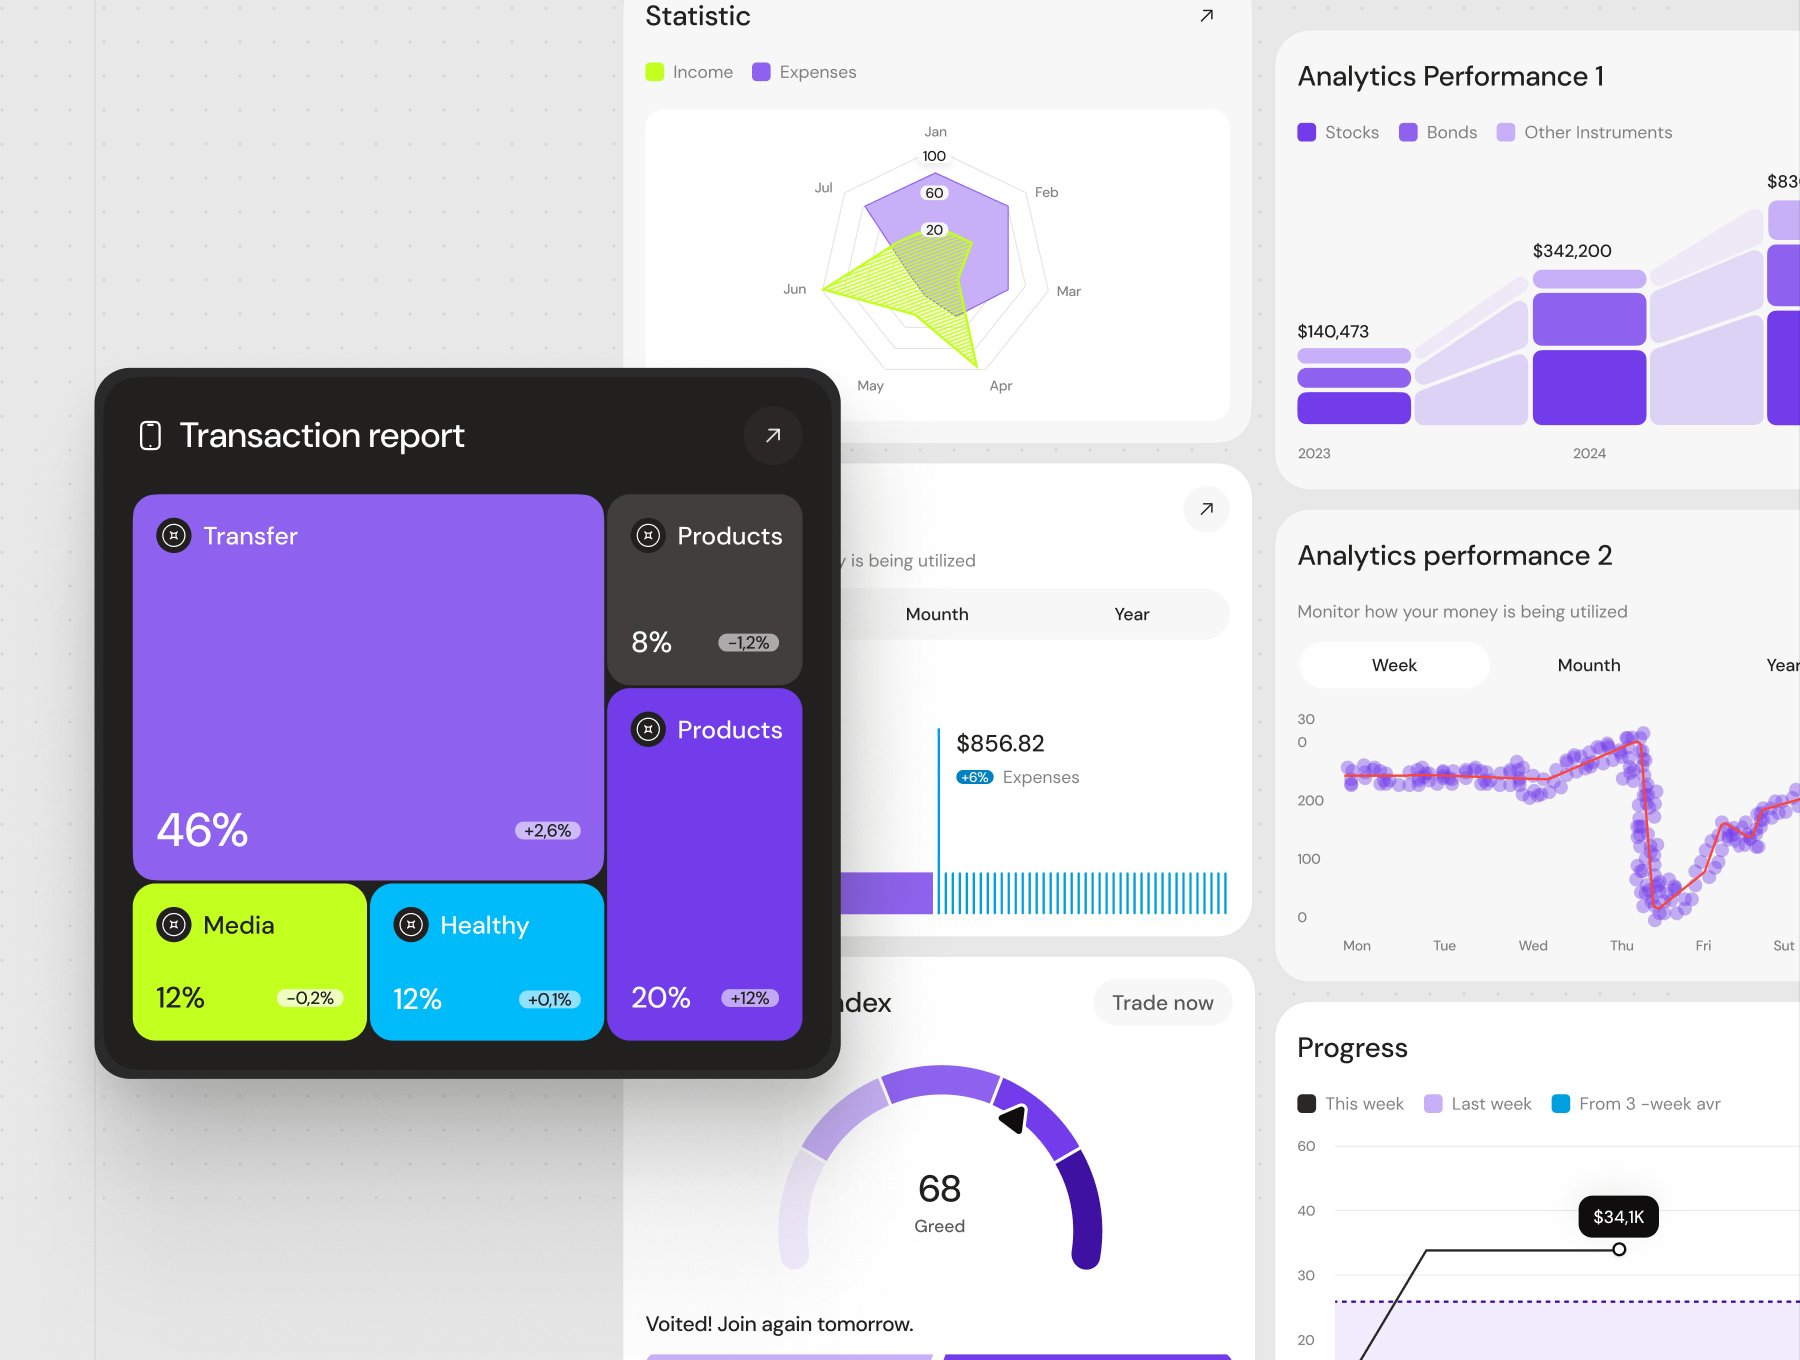
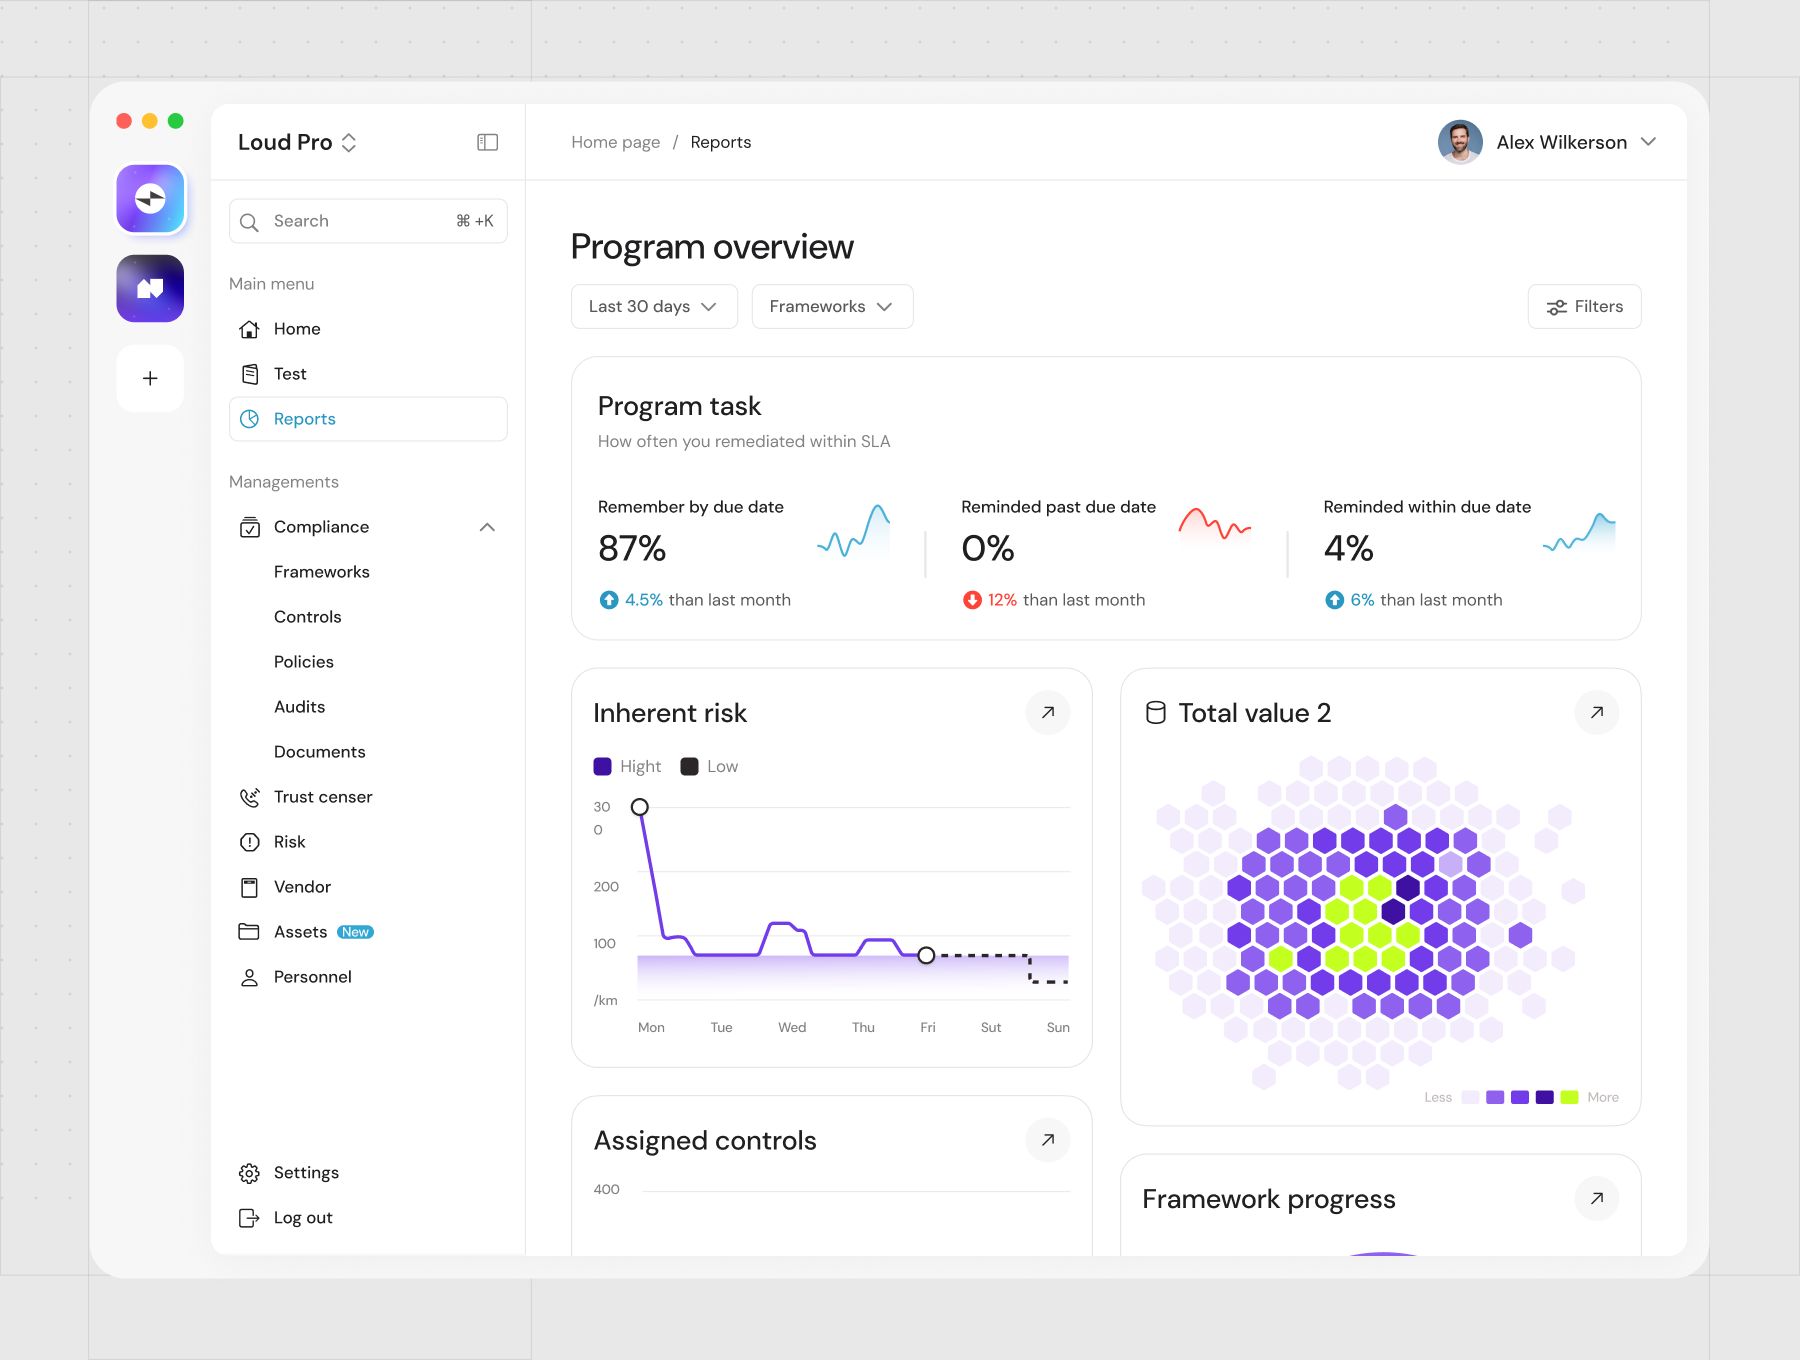
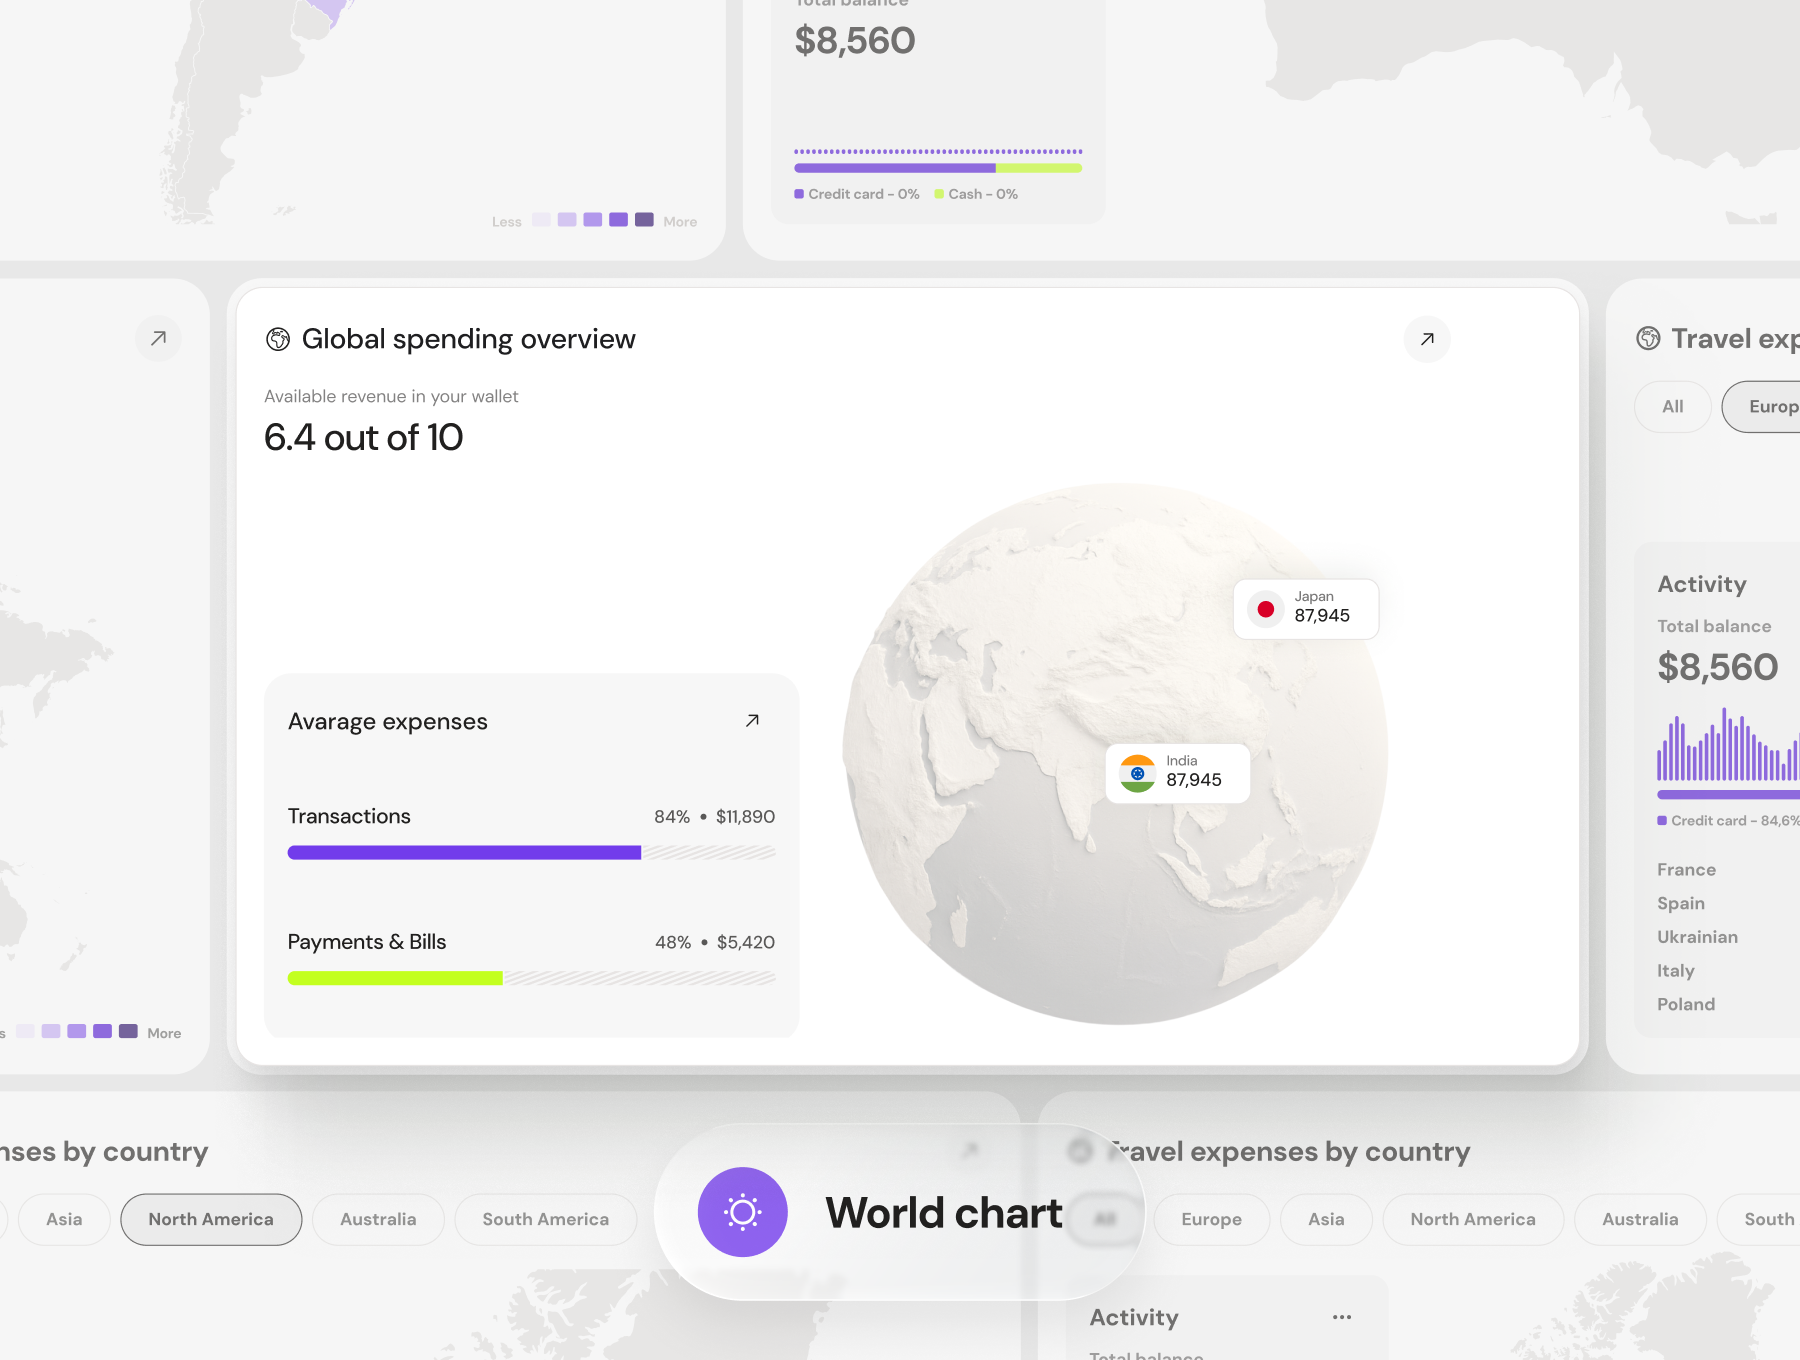
[VIP] Dashboard UI Charts
75+ modern Figma charts and dashboards to visualize data with style and clarity.
![[VIP] Dashboard UI Charts](https://i.pinimg.com/1200x/f0/2d/df/f02ddfc3e44daa330026d5565cf0c9b7.jpg)
Overview
Design powerful analytics dashboards faster with Dashboard UI Charts – your all-in-one Figma library for stunning data visualization.
Each component is built with precision, using modern layouts, clean typography, and smooth color palettes that make complex information look simple and elegant.
Each component is built with precision, using modern layouts, clean typography, and smooth color palettes that make complex information look simple and elegant.
What’s inside:
- 75+ ready-to-use chart components (line, bar, pie, donut, radar, progress & mixed)
- Dashboard templates for real projects
- Light & Dark modes for every element
- Fully customizable with Figma Auto Layout
- Pixel-perfect, scalable, and well-organized layers
Why you’ll love it:
Whether you’re designing finance dashboards, SaaS analytics, or presentation visuals – Dashboard UI Charts helps you move from concept to polished design in minutes.
No need to start from scratch – just drop in your data and focus on the story you want to tell.
Highlights
- 75+ charts
- Full customization
- Responsive components
- Dark & Light themes
- Design system
- Easy-to-use
What's Your Reaction?
 Like
1
Like
1
 Dislike
0
Dislike
0
 Love
1
Love
1
 Funny
1
Funny
1
 Angry
0
Angry
0
 Sad
0
Sad
0
 Wow
0
Wow
0
![[VIP] NexoWallet Fintech App](https://i.pinimg.com/1200x/9d/ae/4b/9dae4bca1f323fb4d1d9bd5a5ff4116e.jpg)
![[VIP] NucaAI: Nutrition & Calories App](https://i.pinimg.com/1200x/98/b3/81/98b381fee4395f4c9585167210969368.jpg)

![[VIP] HeanAI: AI-Chatting Dashboard](https://i.pinimg.com/1200x/fe/a3/39/fea339dffb21b585ca014916e20186b7.jpg)


